The National Football League (NFL) just completed it’s 53 season and only three Quarterbacks have thrown for more than 50 touchdown passes during the course of one season. Both Peyton Manning and Tom Brady are considered to be two of the greatest QB’s of all time, the third, Patrict Mahomes was in just his second season, his first as a starter for the Kansas City Chiefs. Follow along below as I use the programming lanugage R to graph and annimate the touchdowns thrown as they accumulate over the season. Let’s see how they compare!
The following packages have been loaded to assist with the analysis.
library(tidyverse)
library(readr)
library(lubridate)
library(gganimate)
library(extrafont)
Using the readr package, we import the data containing the game by game touchdowns for the three quarterbacks seasons in which they threw 50 or more touchdowns. This infromation was obtained ProFootballReference and manually accumulated in a single spreadsheet.
td_club <- read_csv("~/bdown/content/post/2019-02-09-Top-50-TD-Passers/td_50_club.csv")The code below changes the class of each column, “Date”, “Game” and “TD”. This will assist us later when we graph the results.
td_club$Date <- mdy(td_club$Date)
td_club$Game <- as.integer(td_club$Game)
td_club$TD <- as.integer(td_club$TD)
Next, we will group the data by player and add a running total column to show the cummulative sum of touchdowns thrown as each season progressed. Let’s take a look at the top five rows of the data to make sure everything looks like we want it to.
tds <- td_club %>%
  group_by(Player) %>%
  mutate(Total_TD = cumsum(TD)) %>%
  ungroup()
head(tds, 5)## # A tibble: 5 x 7
## Player Year Date Game Team TD Total_TD
## <chr> <dbl> <date> <int> <chr> <int> <int>
## 1 Peyton Manning 2013 2013-09-05 1 DEN 7 7
## 2 Peyton Manning 2013 2013-09-15 2 DEN 2 9
## 3 Peyton Manning 2013 2013-09-23 3 DEN 3 12
## 4 Peyton Manning 2013 2013-09-29 4 DEN 4 16
## 5 Peyton Manning 2013 2013-10-06 5 DEN 4 20Here we are assigning color’s to each player. The colors assigned here related to the team they played on during the season.
player_color <- c("Peyton Manning" = "#FB4F14", "Tom Brady" = "#002244", "Patrick Mahomes" = "#E31837")Finally we will use ggplot2 to graph the results to show each quarterback compared to each other. I used a bar chart that will build each week and show thet total touchdowns thown. Using the gganimate package, I annimated the graph to show the week by week accumulation.
p <- tds %>%
  ggplot(aes(reorder(factor(Player), Total_TD), Total_TD, fill = Player)) +
  geom_col(position = "dodge") +
  geom_text(aes(label = Total_TD), nudge_y = -3, color = "white", size = 8) +
  scale_fill_manual(values = player_color) +
  scale_y_continuous(breaks = seq(0, 55, 5)) +
  labs(title = "NFL QBs with 50+ TD Passes in a Single Season",
       subtitle = "Game #: {closest_state}",
       x = "", y = "",
       #title = "QB with over 50 TD in a season",
       caption = "@tdemmer18 | 2019-01-28") +
  theme(legend.position = "none",
        rect = element_rect(fill = "grey95"),
        panel.grid = element_blank(),
        panel.background = element_rect(fill = "transparent", colour = "transparent"),
        axis.text = element_text(size = 14),
        axis.ticks = element_blank(),
        axis.text.y = element_blank(),
        axis.text.x = element_text(face = "bold", size = 14),
        axis.line = element_blank(),
        plot.title = element_text(hjust = 0.5, size = 18),
        plot.subtitle = element_text(hjust = 0.5, size = 16),
        plot.caption = element_text(size = 12),
        strip.text = element_text(size = 16, face = "bold"),
        strip.background = element_rect(colour = "black", fill = "white")) +
  facet_wrap(~ Year, scales = "free_x") +
  transition_states(Game) +
  enter_grow()

animate(p, nframes = 32, fps = 1.5, renderer = gifski_renderer(loop = FALSE))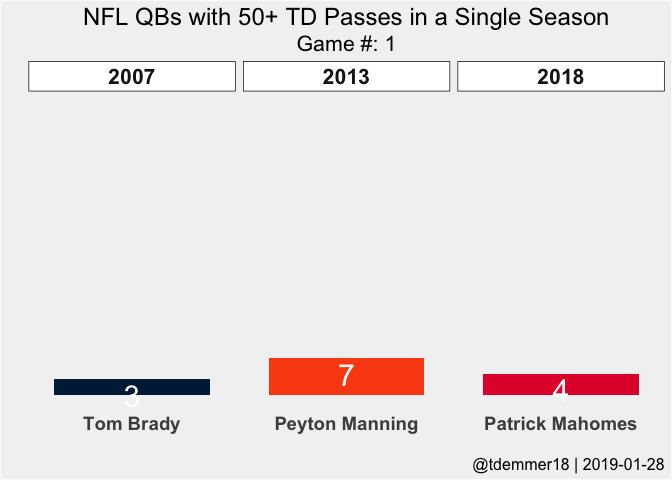
Conclusion
In the end, Peyton Manning is still king! He started out hot throwing 7 touchdowns in his first game and then finished off his record setting season to end with 55 touchdowns thrown. Both Brady and Mahomes finished the season with 50 touchdowns, a defeat very impressive in itself, just not enough to match the great Peyton Manning!